Meta Diary
2022.03 (2 weeks)
Program: Arduino, HTML, JavaScript, AdafruitIO
Device: Esp32, light sensor, temperature sensor, distance sensor
As the use of human technology expands into the realm of media, our bodies embrace more senses. I began by creating devices that could collect data from nearby surroundings to explore how digital technology expands and enhances our vision of our senses, bodies, and ourselves. It takes over the role of extension of my body and sensory organs. In other words, this device expands the sense that I feel hot or cold, the distance from the object (person), and the brightness of the space in which my body is located.
This project is a meta-diary consisting of my daily data from 00:00 on March 16, 2022, to 00:00 on March 18, 2022.
This diary is created by quantifying the temperature, light, and distance with objects (people) that are constantly occurring in everyday life, storing them as data, and changing them to visuals.
Process
For daily data collection, a machine capable of data collection was created using a light sensor, a distance sensor, and a temperature sensor. After that, saved the code to Esp32 using Arduino and connected the battery for collecting data while carrying it around in everyday life without a laptop. The collected data value is updated to the AdafruitIO feed through a network connection (wifi and mobile phone hotspot).
Data collect _ AdafruitIO feed
Data was collected from 00:00 on March 16 to 00:00 on March 18. Based on these data values, visual works were created using HTML and JavaScript. In addition, the values of the data are divided into days, hours, and minutes.
This meta-diary generates an arc based on the data values below.
The x-coordinate of the arc's ellipse is changed by light sensor values.
The y-coordinate of the arc's ellipse is changed by temperature sensor values.
The stroke weight of the arc’s ellipse is changed by distance sensor values.
The color mode of created arcs is changed by distance sensor values with time values.
The hue value is changed by distance values * minutes values.
The saturation value is changed by distance values * hours values.
The bright value is changed by distance values * day values.
Problem & Solution
The color mode was set from RGB to HSB in order to control various color changes and opacity of the arc. At this time, the hue value was set using distance values and minute values, but if the distance value was used as it is, the red value was very high, so it did not change to various colors. Therefore, the minimum and maximum values of distance values were mapped to 0 and TWO_PI(circle) values using the Map function. After that, the maximum distance was multiplied by 60 as a unit of time.
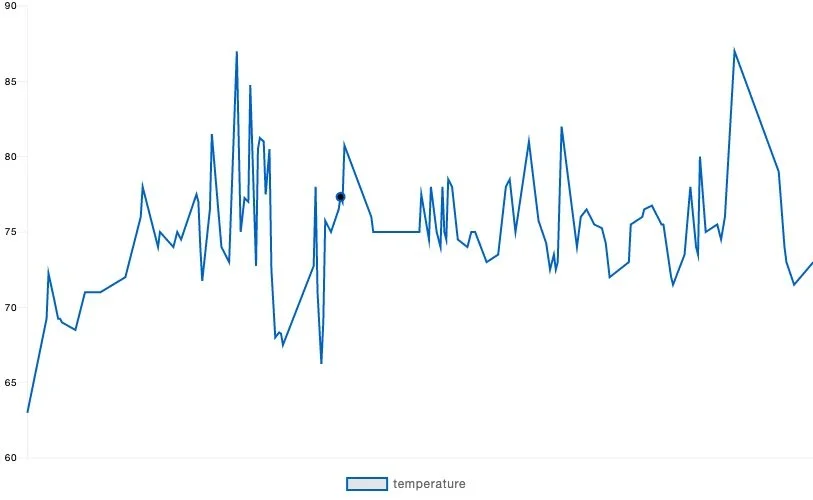
Temperature data (03/16/2022 00:00 am - 03/17/2022 00:00 am)
Light data (03/16/2022 00:00 am - 03/17/2022 00:00 am)
Distance data (03/16/2022 00:00 am - 03/17/2022 00:00 am)
Temperature data (03/17/2022 00:00 am - 03/18/2022 00:00 am)
Light data (03/17/2022 00:00 am - 03/18/2022 00:00 am)
Distance data (03/17/2022 00:00 am - 03/18/2022 00:00 am)


